
Dashboard tour - KPIs, sentiment & goals
Your Dashboard shows your key numbers, AI sentiment analysis and weekly trends at a glance.
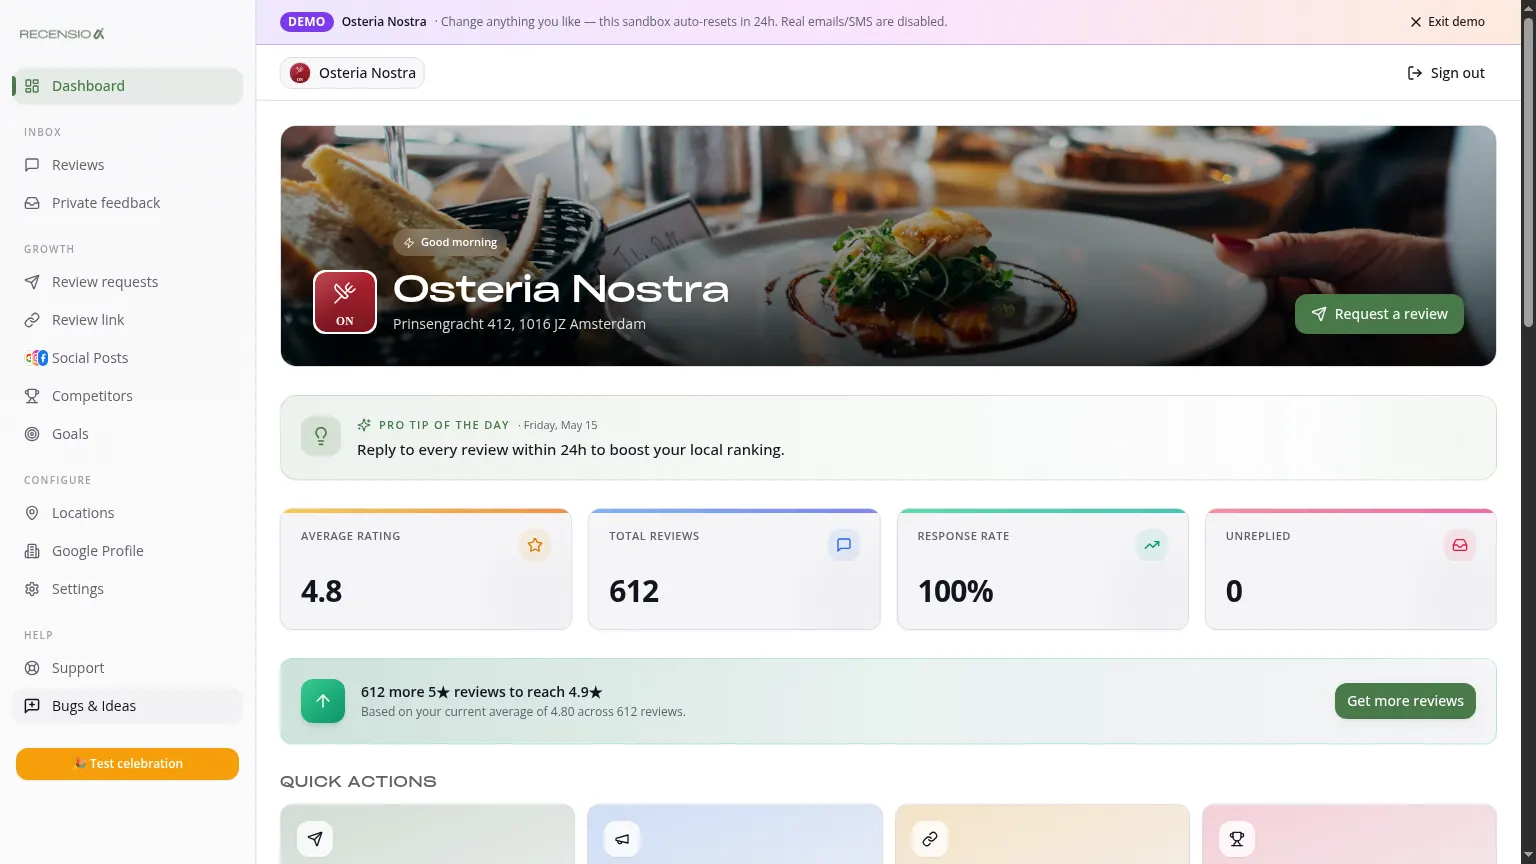
Table of Contents
What's on the Dashboard?
At the top: 4 KPI cards, average rating, total reviews, response rate (% replied) and unreplied count. They update live as new reviews come in.
Sentiment tab
Below the KPIs you will find tabs. The Sentiment tab combines reviews from Google, Treatwell and your other connected review platforms from the latest six months. AI groups recurring themes such as service, quality, price and wait time, and highlights staff and location signals. An issue normally appears only after three different customers mention it, or two for a location with few reviews. This keeps one isolated comment from becoming a business priority.
Performance tab
Shows your trend over time: new reviews per week, average rating per month and your response rate. Compare periods to see if your campaign is working.
Goals tab
Tracks your onboarding goal plus the math on how many 5★ reviews you need to reach a higher average. E.g. moving from 4.6 to 4.7 with 200 existing reviews needs ~12 new five-stars.
Quick actions
Below the tabs: four buttons - Send requests, Generate posts, Share Review Link and Check competitors. One click takes you to the right tool.
Multi-location portfolio
Have multiple locations? Pick 'All locations' top-right for an aggregated portfolio view, total KPIs, best/weakest location and a leaderboard.
Was this article helpful?
Ready to try RecensioAI?
Collect more reviews, respond with AI and protect your reputation.
Get started free